
Climbing readiness: why one number hides a tired finger
What a hard session actually costs, which parts of it the app models, and what the score does not claim
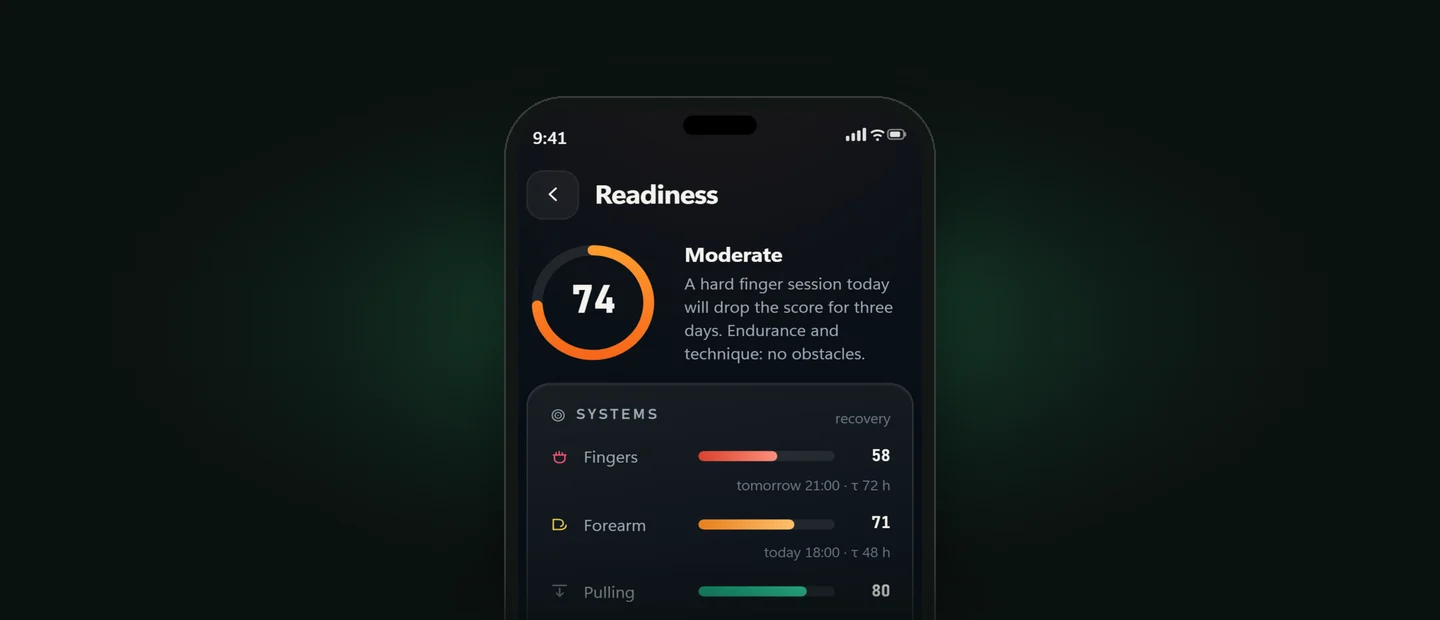
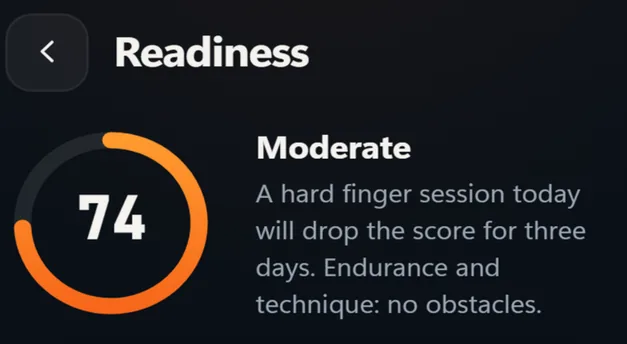
Every fitness app will tell you how recovered you are. One number, usually green. A climbing readiness score built that way hides the thing a climber most needs to see.
Here is the thing it hides. After bouldering until they could not do another problem, finger-hang endurance fell 34.2% while explosive pulling power fell 4.8% — same 28 climbers, same evening.
And the intuition behind one number does not hold up well anywhere — not even for runners. In 435 Dutch runners the same kind of score came out backwards: the model expected the least-trained group to get hurt most (Nakaoka, Barboza, Verhagen, van Mechelen & Hespanhol, Sports Medicine, 2021).
You can be fresh everywhere and still have nothing left for a small edge.
What a hard session actually does to a climber
The study to know is small and direct. Twenty-eight recreational indoor boulderers climbed until they could not do another problem, and were measured before and minutes afterwards (Wilczyński, Nowosad, Poniatowski, Gerwann & Zorena, Frontiers in Physiology, 2026).
Nothing fell by the same amount. Finger-hang endurance dropped 34.2% — a large drop, and very unlikely to be chance (dz −0.85, p < 0.001; the smaller that p, the less likely chance). Pinch grip dropped 5.8% (p = 0.009). Explosive pulling power dropped 4.8% (p = 0.010).
Those are not three views of one thing. One is how long the fingers hold, one is how hard they squeeze, one is how fast the arms pull. In the same climbers on the same evening, the three results differed about sevenfold.
That spread is the whole case for splitting a recovery score up, and it is maths rather than biology. Average a 34% fall with a 5% fall and you are down about 20% overall — a score around 80 on the evening your fingers have a third less in them.
Splitting it is not a richer view of the same information. It is the only way the 34% stays visible at all.
One measure went the other way. Their ability to hold a sequence of moves in their head — visuospatial working memory — improved 16.4% (p = 0.008) after the same session, which the authors say “challenges simple fatigue-impairment assumptions”. Fatigue is not one dial turning down.
Be exact about what this study covers. Recreational indoor boulderers, indoor bouldering, measured minutes after the session rather than two days later. This is about the hour after you climb, not the days after: what the numbers look like two days later is not something these 28 people can tell you.
Fingers are what climbers report injuring
Nobody has shown that watching a finger number changes that, so take what follows as context, not as a claim about the score. In 745 everyday climbers who filled in a survey about themselves, 77% reported at least one injury, most commonly to the fingers and/or hands (70%) (den Hengst, Powis, Cooper, Diamond & Tuaño, BMJ Open Sport & Exercise Medicine, 2026).
The tissue is not mainly tendon. Among the injured climbers in that survey: joint pain or swelling 47%, pulley injuries 47%, flexor tendon injuries 14%. So most of what gets hurt is pulleys and finger joints.
A second survey agrees on the ranking and adds a site climbers forget. In Slovenian climbers: fingers 50%, shoulders 32%, elbows 16% (Hlebš & Brezovar, Journal of Sports Medicine and Physical Fitness, 2026). Different climbers, a different question — the 50% and the 70% are not two goes at the same figure.
The evidence that cuts the other way belongs in the open rather than in a footnote. Climbers who turned up at US emergency rooms between 2014 and 2023 broke down the other way, counting legs and feet ahead of arms and hands — “lower extremities were most frequently injured (50.6%), followed by upper extremities (26.7%)” (Lin, Khera, Furtado & Saiz, JB & JS Open Access, 2026).
So: fingers are the most commonly reported injury among climbers who answer surveys. That is a real fact and a narrow one.
What climbing recovery research does not show
This is the part training articles skip. No climbing study measures how long tiredness in one system takes to fade. Not fingers, not forearms, not anything else. We looked, and the absence is the finding.
The nearest anyone has come to tracking fatigue day by day is in other muscles in other sports, and it runs against what everyone assumes. After hard sprint intervals, how hard a big muscle could push at full effort was still measurably down at 24 hours (p = 0.001) and 48 hours (p = 0.003).
That was thigh muscles, in people who do not climb (Freitas, Marín-Cascales, Marín-Pagán, Chung, Martínez-Serrano, Maffiuletti, Blazevich & Alcaraz, Journal of Functional Morphology and Kinesiology, 2026). So the comfortable version — two days later the pulling muscles feel fine — does not survive contact with the only day-by-day data there is.
Central fatigue — tiredness in the brain and nerves rather than in the muscle — is measured in minutes. Measuring directly how much of a muscle the brain can switch on, researchers report “recovery of central fatigue (typically within 2 min)” after brief high-intensity work, and that after long low-intensity work muscles “may not recover completely within 30 min” (Carroll, Taylor & Gandevia, Journal of Applied Physiology, 2017).
How much oxygen is in the forearm is real and well studied in climbers, and it swings back within seconds (Vandenhaute et al., Frontiers in Sports and Active Living, 2026). Nothing supports forearm tiredness that hangs around for days.
The nearest thing to a finger recovery window is not one. Grip strength was still measurably lower at 48 hours in the people who just rested — but that came from a trial comparing hot-and-cold water treatments, not from a study that tracked how strength came back (Hagner-Derengowska et al., Journal of Clinical Medicine, 2026).
How the app models it
What follows is a list of settings we chose, not biology. ClimbingDad tracks six systems and gives each a recovery rate. Those rates are numbers the app chose. Nobody has measured them in climbers. The screen below prints one of them as “τ 72 h” — τ is how long the app assumes a system's load takes to fade, and the 72 hours it gives CNS is the worst of the six.
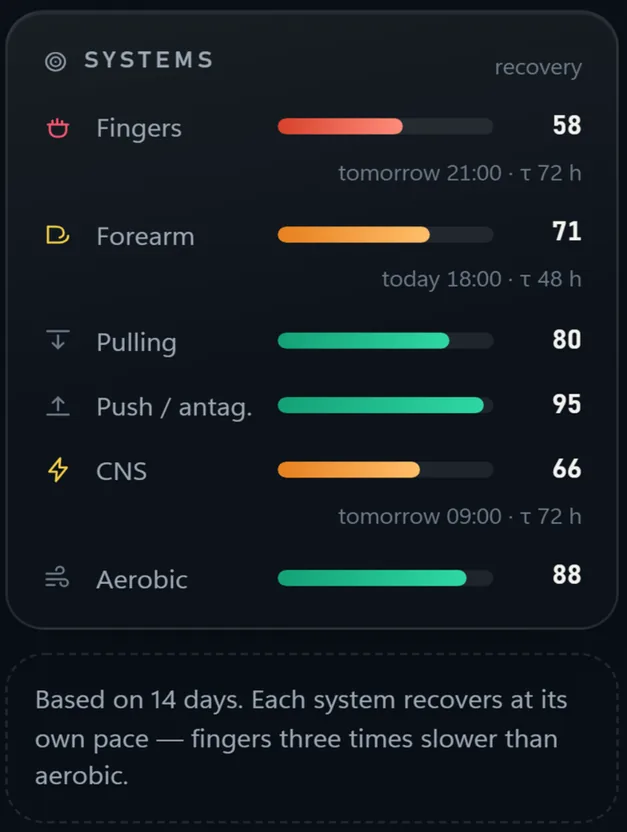
The six, as the app labels them: Fingers, Forearm, Pulling, Push / antag. (pushing and antagonist work), CNS and Aerobic. CNS is the app's label for the central fatigue above. The numbers the app chose for how long each one's load takes to fade: fingers 72 hours, CNS 72 hours, forearm, pulling and push 48 hours, aerobic 24 hours.
So here is the problem, in the open. The app gives CNS the same 72 hours as the fingers. Direct measurement puts central fatigue recovery at roughly two minutes: two minutes against 72 hours, so the app's number is about a thousand times too long.
There is no physiological justification for 72 hours and we are not going to invent one. It is a number we picked when we built it. Our judgement, and only that: the honest fix is to rename that system, not to defend the number.
The inputs are the sessions you logged, nothing else. Each kind of work — climb, hangboard, campus, gym, cardio, mobility, other — counts differently towards each of the six systems, and “other” adds no load on purpose.
Intensity comes from how hard the session felt to you — the rating you give it afterwards, called session RPE — plus, on hangboard work, how much weight you used compared with your own best on that edge. Not from the grade, and on every other kind of work the load counts as neutral. Volume comes from sets completed against sets planned. It always looks at your last 14 days.
Session RPE is a standard way of measuring how hard a session was on you. It has been tested in team sports, never in climbing.
It lined up closely with heart-rate measures in elite women's handball — r = 0.78, where 1.0 would be a perfect match (Struzik, Nadobnik & Stępień-Słodkowska, Scientific Reports, 2026). A different question, a much looser answer: over 45 weeks in 189 elite athletes, training load and how stressed athletes felt lined up only weakly (r = 0.19–0.46, Drole et al., Frontiers in Psychology, 2024).
Why it uses how the session felt, not a wearable
Across 56 studies of athlete monitoring, what athletes said about themselves and what machines measured did not line up — “subjective and objective measures of athlete well-being generally did not correlate” — and it was what the athletes said that tracked their training loads “with superior sensitivity and consistency than objective measures” (Saw, Main & Gastin, British Journal of Sports Medicine, 2016).
The wearable alternative is not clearly better. In a study following 121 people, how ready they felt did not match what their watch was measuring — “subjective feelings of readiness may not correspond to activity tracker biometrics” (Ungaro, Wolfe, Isaacs, De Chavez & Freese, Sensors, 2026).
A review of training guided by heart rate variability — the tiny changes in the gap between heartbeats — names its primary limitation as “the lack of transparent and physiologically grounded decision frameworks” and scores whose workings the companies keep secret, which “may oversimplify training decisions” (Schaffarczyk & Sperlich, Frontiers in Sports and Active Living, 2026). The catch, in the same breath: a training log is blind to sleep, stress and illness.
What the score does not claim
It does not predict injury. It does not flag a risky day. It does not catch overtraining. It is not built to do any of those things, and this page says so outright.
The reason is worth printing. The score belongs to a family — add up recent training, let it fade — whose injury claims have collapsed.
- The best-known member of that family is the acute:chronic workload ratio — recent training divided by usual training. It “is an inaccurate metric... it adds noise and creates statistical artifacts”, and changing injury rates by manipulating it “remains a conjecture” (Impellizzeri, Tenan, Kempton, Novak & Coutts, International Journal of Sports Physiology and Performance, 2020).
- Across 41 studies, 797 athletes between them, the link with getting injured was small to moderate (g = 0.35) and the studies disagreed with each other almost completely (I² = 95.8%). Used on its own, to name a cause or pick out who will get hurt: “current evidence does not support its use as a stand-alone causal or predictive model” (Ding, Weldon, Xu, Malone, Sampaio et al., Frontiers in Public Health, 2026).
- In 435 Dutch runners the direction inverted: the model expected about 10 in 100 of the least-trained runners to get hurt, against about 1 in 100 of the most-trained (Nakaoka et al., 2021).
- “Using a ratio to represent changes in activity may not always be appropriate” (Wang, Vargas, Stokes, Steele & Shrier, Sports Medicine, 2020).
So the score describes what you did, decayed over time. Anything more is marketing.
What a low score is for
Redirection, not permission. That a tired climber loses maximal finger and pulling output is measured. That a modelled number picks out those days is not measured at all. Read a low bar as a prompt, not a verdict. The bars run 0 to 100, and the app draws no line on them, because there is no measured line to draw: read a bar against your own recent ones, not against a cutoff.
Fingers low, everything else fine. Footwork, technique and antagonist work survive, because none of them pull on the finger tendons. That is the only reason they survive: whether antagonist work prevents injury has not been shown either way — what the gym has and has not been shown to do goes through that evidence. The one thing ruled out is volume climbing on big holds — it still loads the fingers.
On active recovery — moving gently instead of resting, which the study shortens to AR — the one climbing study is blunt: “easy climbing or intermittent isolated forearm contractions should not be used as AR strategies... using the same muscle group for AR should be avoided” (Krupková, Tufano & Baláš, Frontiers in Sports and Active Living, 2024).
It only looked at 22-minute rest breaks inside a single session, so treat it as suggestive rather than decisive. A low finger bar does not block an endurance session; it just does not count as recovery.
Forearm endurance low. The usual prescription — short powerful problems, long rests — has no study behind it, and it runs into the same wall as the line above: powerful problems load the fingers harder than big holds do, not less.
No study says what does work. The trade-off is the answer: anything powerful enough to spare the forearms loads the fingers harder, so pick which of the two you are sparing today and know you are picking.
CNS low, tissue fine is not a state the literature recognises across days, so there is nothing here to prescribe. The narrow version: if you are flat, maximal output will be down. Your head may be fine — the ability to hold a sequence of moves went up 16.4%.
Everything low. Our judgement: take the rest day and keep the training block. It is a judgement, not a finding — the one randomised deload trial found that a deload week hurt lower-body strength (Coleman et al., PeerJ, 2024). We still think the rest day is worth it; you should know what you are buying.
What it cannot see
An honest list, because a score that pretends to know everything is worse than none.
- Sleep, stress and illness. No wearable feeds this, so a bad fortnight at work is invisible — see above for why that is a smaller gap than it sounds.
- Sessions you did not log. The model only knows what you told it.
- Pain. A readiness score of 90 with a sharp twinge in a finger means stop. The twinge wins, always.
- Your history. It does not know about the pulley you injured two years ago. A previous injury is one of the few things actually shown to make another one more likely in climbing (Quarmby et al., Frontiers in Sports and Active Living, 2023) — which is a fact about you to carry into the decision yourself, not a gap the score is built to close.
Which is why it is a widget on the home screen next to today's session, not a gate in front of it.
Where it fits
Watched over weeks rather than day to day, a readiness score is a rough stand-in for what training is doing to you — an “operational proxy for training effects” (Rebelo et al., Sports Medicine, 2026). That is the honest size of the claim. The week you planned is a guess until the log says otherwise — see how to build a training week.
It has the most to work with around finger training, because those sessions are logged with an edge and a load, not a feeling: see the hangboard guide.
If you train with a coach, they see what you logged. They cannot write your log — that is enforced in the database, not in the app. How coaching works.
Questions climbers ask
How is a climbing readiness score calculated?
From the sessions you logged. Each kind of work — climb, hangboard, campus, gym, cardio, mobility, other — counts differently towards the six systems, and “other” adds no load on purpose. Intensity comes from how hard the session felt to you (session RPE) plus, on hangboard work, how much weight you used against your own best on that edge; volume from sets completed against sets planned. It always looks at your last 14 days, and it takes about that much logging before the six bars say much.
The rate each system then recovers at is a number the app chose, not one anyone has measured in climbers.
Does a low readiness score mean I should not climb?
No. It is a redirection, not a veto. Technique, footwork and antagonist work are all still on. What the evidence supports is narrow: a fatigued climber loses maximal finger and pulling output. Ground the decision in that, not in the number.
Does climbing readiness need a wearable or a heart rate strap?
No, and that is a design choice rather than a gap. Across 56 studies, subjective measures reflected training loads “with superior sensitivity and consistency than objective measures” (Saw, Main & Gastin, 2016). It is still blind to sleep and stress, which is why it informs rather than decides.
Does the readiness score predict injury?
No, and it does not try to. The rolling-window family it belongs to does not support that use: the acute:chronic workload ratio “adds noise and creates statistical artifacts” (Impellizzeri et al., 2020), and across 41 studies “current evidence does not support its use as a stand-alone causal or predictive model” (Ding et al., 2026).
Why track fingers separately from everything else?
Because the fall is not even. After bouldering until they could not do another problem, finger-hang endurance fell 34.2% while explosive pulling power fell 4.8% in the same 28 climbers (Wilczyński et al., 2026). One whole-body number averages that 34.2% away, so tracking fingers separately is the only way the drop stays visible. It is not an injury warning: the score does not predict injury.